
Business Analytics with Excel is the practice of using Microsoft Excel’s powerful tools and functions to collect, organize, analyze, and visualize business data. Excel provides an accessible platform for deriving insights from raw data, identifying patterns, making data-driven decisions, and forecasting future trends. From simple spreadsheets to advanced data models and dashboards, Business Analytics with Excel bridges the gap between complex data sets and actionable business strategies.

Learn from certified professionals with extensive industry experience
Work on real-life business scenarios and data sets
Choose between live instructor-led sessions and self-paced modules
Community Support and Networking Opportunities


Emax Technologies empowers learners with industry-relevant skills, leading to career advancements, better job opportunities, and higher salary growth.


Our Business Analytics with Excel course is designed for business professionals, analysts, and students who want to master the art of data-driven decision-making. Whether you’re starting your analytics journey or looking to enhance your Excel skills for better strategic outcomes, this course provides hands-on learning through real-world business scenarios and projects.
Accelerate your career with the Business Analytics with Excel certification program from Emax Technologies. This industry-relevant training empowers you to master key analytical techniques, advanced Excel functionalities, and data visualization strategies. You’ll work through real-world business scenarios, applying best practices to extract insights, drive smarter decisions, and optimize business performance. Through hands-on learning, you’ll gain the skills needed to automate reporting, streamline analysis, and lead data-driven initiatives across diverse business environments.


Get the real classroom experience. Interact with learners and engage with mentors in real-time via Slack.
Missed a class? Access recordings to always maintain learning progress and keep up with your cohort.
Expert guidance sessions from mentors for doubt clarifications, project assistance, and learning support.
Get a dedicated Cohort Manager for all your queries and help you succeed at every learning step.





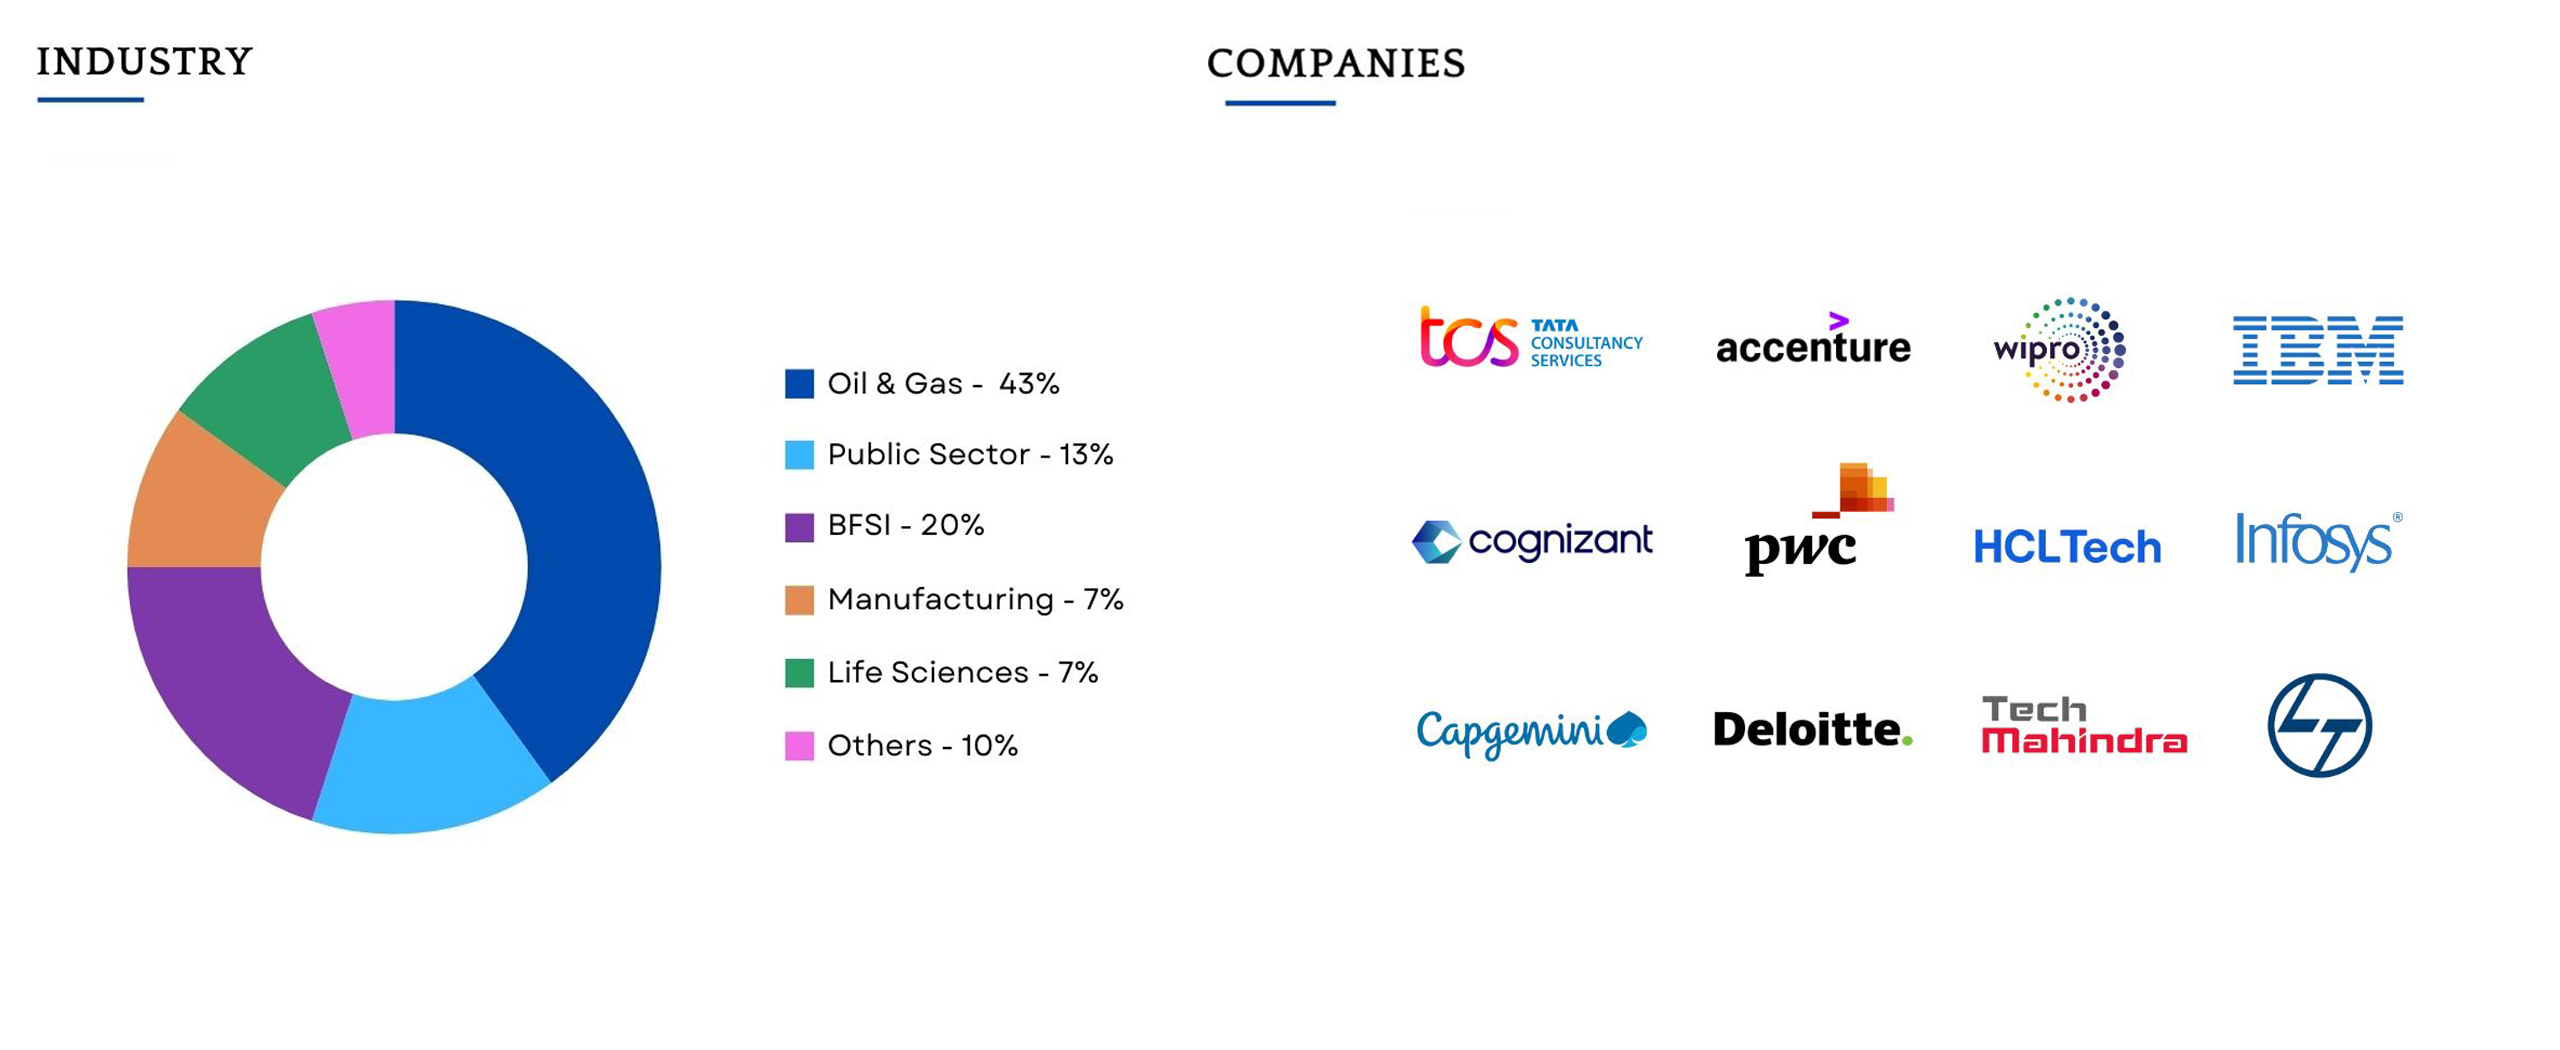
This program caters to working professionals from a variety of industries and backgrounds; the diversity of our students adds richness to class discussions and interactions.
The Gen AI module was an eye opener for me. The mentor’s teaching style in the weekend sessions was spot on. While there’s a lot of Gen AI content online, this module stood out for its structured approach and the mentor’s interactive guidance. It made learning about AI easy, even for beginners like me.
Lead Consultant
Excellent training experience from EMAX Technologies. I took the SAP PI/PO and it was a great experience . I liked trainer sessions as he was more focused on practical rather than theory and helped answer all the queries during the sessions. . Support staff is excellent and very professional, the amount of time they spend with each customer is really appreciated. Keep up the great work!..Great work done by guys like U………!!!!!!!!!!!!!!!!

You will never miss a lecture at Emax You can choose either of the option: View the recorded session of the class available in your LMS.
Your access to the Support Team is for lifetime and will be available 24/7. The team will help you in resolving queries, during and after the course.
Post-enrolment, the LMS access will be instantly provided to you and will be available for lifetime. You will be able to access the complete set of previous class recordings, PPTs, PDFs, assignments. Moreover the access to our 24×7 support team will be granted instantly as well. You can start learning right away.
Yes, the access to the course material will be available for lifetime once you have enrolled into the course.
Copyright © 2025 Emax Technologies | All Rights Reserved. Designed by Web Rocz.
SAP® is a registered trademark of SAP SE in Germany and in several other countries. All SAP modules, including but not limited to SAP FI (Financial Accounting), SAP MM (Materials Management), SAP SD (Sales and Distribution), SAP HR (Human Resources), SAP FICO (Financial Accounting and Controlling), SAP PP (Production Planning), and others, are proprietary products of SAP SE.
This website provides educational resources related to SAP® modules, including descriptions of functionalities and their applications. However, [Your Company Name] is in no way associated, sponsored, or endorsed by SAP SE, and it does not offer SAP® official training, courses, or certifications unless explicitly mentioned.
All other product names, logos, and trademarks mentioned on this website, such as SAP S/4HANA, SAP Ariba, SAP SuccessFactors, SAP C/4HANA, SAP BusinessObjects, SAP BW, and SAP Analytics Cloud, are trademarks or registered trademarks of SAP SE and its affiliates.
ITIL®, PRINCE2®, MSP®, Scrum certifications, and other referenced frameworks or certifications mentioned are the respective trademarks of AXELOS Limited, Scrum Alliance, Scrum.org, and other industry organizations.
The use of SAP® product names and trademarks here is solely for educational purposes, and no claims of affiliation or endorsement by SAP SE are implied. For official SAP® training, support, and certification, please consult authorized SAP® providers or partners.
SAP® is a registered trademark of SAP SE in Germany and in several other countries. All SAP modules, including but not limited to SAP FI , SAP MM , SAP SD , SAP HR , SAP FICO , SAP PP , and others, are proprietary products of SAP SE.